Small requests hold at two thirds, Ontario gains and the Prairies cool
Two thirds of personal loan requests between July and September 2026 were under $1,500, the same share as in the first half of the year. Paying off bills was again the most common reason to apply. Ontario's demand per person rose, while Alberta, Saskatchewan and Manitoba came down from their first-half highs. For the first time, the Index reports approval speed: 97% of approvals in our lending network came within 24 hours.
66% of personal requests were under $1,500. The average small request was $487.
Paying off bills was the most common reason to apply, as in the first half.
Up from 111. Ontario made up 46% of applications from the ten provinces.
Down from 158, still the highest. Saskatchewan fell from 124 to 109.
Share of approvals in our lending network that came within 24 hours of the application.
The first-half edition asked whether the move to smaller requests would last. Requests under $1,500 made up 66% of personal applications in the third quarter, the same two thirds as from January to June.
Request sizes eased a little at both ends. The average small request was $487, down $8. The average installment request was $5,947, down about $110.
Personal requests are split at $1,500, the Criminal Code ceiling for the payday loan exemption. The segment names describe the size of the request, not the product the applicant received. A request of exactly $1,500 counts as installment.
| Segment | Share, Q3 2026 | Share, H1 2026 (1 January to 30 June) | Change | Average request, Q3 2026 | Average request, H1 2026 |
|---|---|---|---|---|---|
| Small-dollar (under $1,500) | 66.0% | 66.2% | -0.2 pts | $487 | $495 |
| Installment ($1,500 and up) | 34.0% | 33.8% | +0.2 pts | $5,947 | $6,060 |
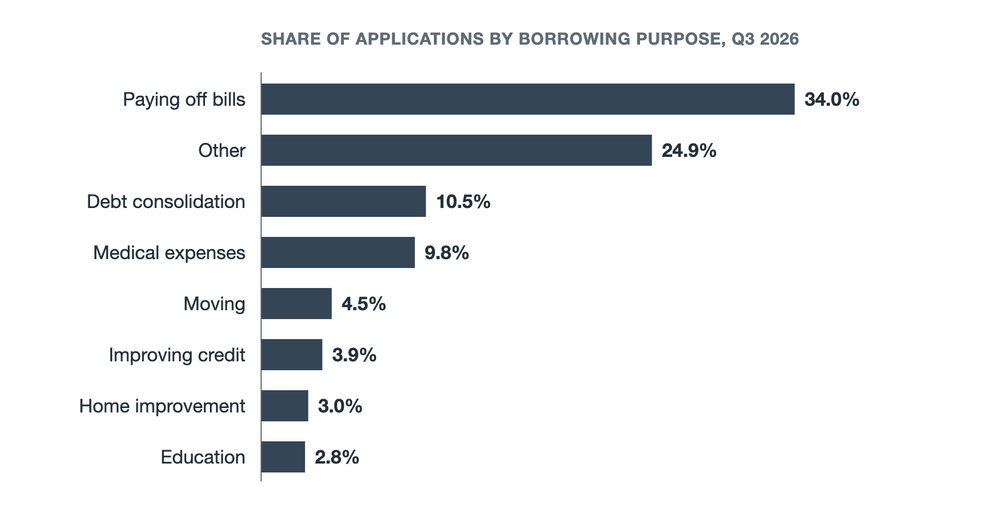
Paying off bills led again, at 34% of applications. Debt consolidation and medical expenses followed at about one in ten each. Education rose the most, and no purpose moved by more than a point.
Debt consolidation drew the largest installment requests of the common purposes, at about $8,600 on average. Only people starting a business asked for more, at about $9,100.
Other collects applications where the applicant picked Other rather than a listed purpose.
| Purpose | Share, Q3 2026 |
|---|---|
| Paying off bills | 34.0% |
| Other | 24.9% |
| Debt consolidation | 10.5% |
| Medical expenses | 9.8% |
| Moving | 4.5% |
| Improving credit | 3.9% |
| Home improvement | 3.0% |
| Education | 2.8% |
| Purpose | Share, Q3 2026 | Share, H1 2026 | Change | Small-dollar average, Q3 2026 | Installment average, Q3 2026 |
|---|---|---|---|---|---|
| Paying off bills | 34.0% | 34.4% | -0.4 pts | $507 | $4,589 |
| Other | 24.9% | 25.2% | -0.3 pts | $433 | $5,145 |
| Debt consolidation | 10.5% | 10.2% | +0.3 pts | $631 | $8,574 |
| Medical expenses | 9.8% | 9.6% | +0.2 pts | $449 | $4,932 |
| Moving | 4.5% | 4.4% | +0.1 pts | $502 | $4,578 |
| Improving credit | 3.9% | 4.0% | -0.1 pts | $528 | $5,955 |
| Home improvement | 3.0% | 2.8% | +0.2 pts | $540 | $7,289 |
| Education | 2.8% | 2.2% | +0.6 pts | $520 | $5,944 |
| Starting a business | 1.3% | 1.6% | -0.3 pts | n/a | $9,137 |
| Travel | 1.2% | 1.2% | 0.0 pts | $487 | $4,469 |
| Wedding or event | 1.1% | 1.0% | +0.1 pts | $485 | $6,620 |
| Vacation | 0.9% | 0.6% | +0.3 pts | $610 | $5,068 |
| Investment | 0.7% | 0.8% | -0.1 pts | $510 | $6,363 |
| Ten smaller purposes, combined | 1.3% | 0.5% | n/a |
n/a: fewer than 100 applications. Smaller purposes stay in every share's denominator.
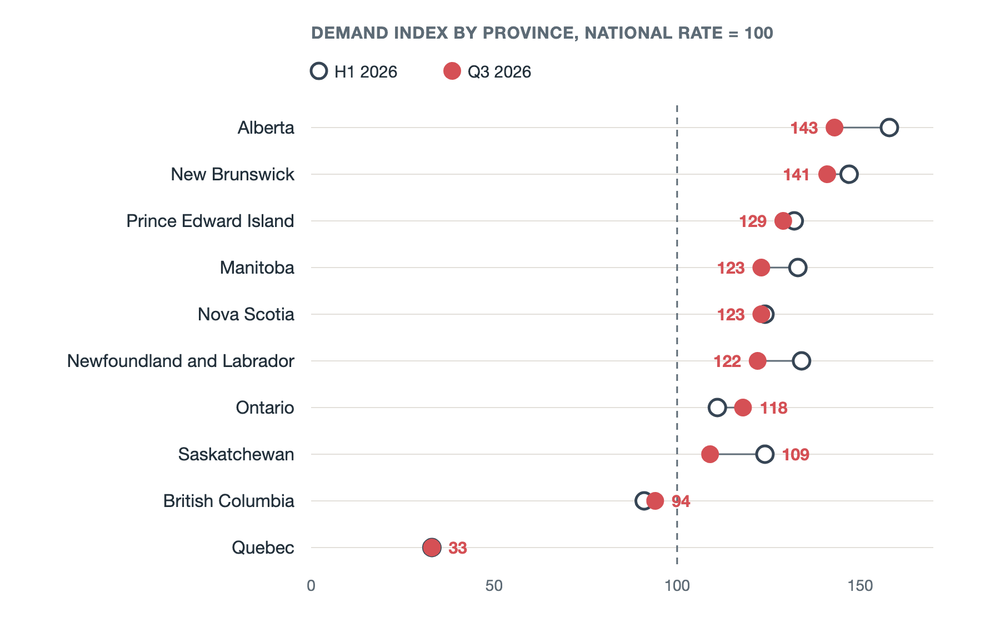
Ontario's demand index rose from 111 to 118, and its share of applications from about 44% to 46%. British Columbia rose 3 points to 94.
Alberta still has the highest demand per person, at 143, down from 158. Saskatchewan fell 15 points to 109, Newfoundland and Labrador 12 to 122, and Manitoba 10 to 123.
Every province except British Columbia and Quebec sat above the national rate. New Brunswick, at 141, is now close behind Alberta. Quebec's index of 33 reflects a different market rather than lower need. The province can refuse a lender's permit above a 35% credit rate, so conventional payday lending is largely absent. Quebec applicants also made the largest small requests, at $560 on average.
| Province | H1 2026 | Q3 2026 |
|---|---|---|
| Alberta | 158 | 143 |
| New Brunswick | 147 | 141 |
| Prince Edward Island | 132 | 129 |
| Manitoba | 133 | 123 |
| Nova Scotia | 124 | 123 |
| Newfoundland and Labrador | 134 | 122 |
| Ontario | 111 | 118 |
| Saskatchewan | 124 | 109 |
| British Columbia | 91 | 94 |
| Quebec | 33 | 33 |
| Province | Demand index Q3 2026 | Demand index H1 2026 | Change | Share of applications Q3 2026 | Change in share |
|---|---|---|---|---|---|
| Alberta | 143 | 158 | -15 | 17.5% | -1.9 pts |
| New Brunswick | 141 | 147 | -6 | 2.9% | -0.2 pts |
| Prince Edward Island | 129 | 132 | -3 | 0.6% | 0.0 pts |
| Manitoba | 123 | 133 | -10 | 4.5% | -0.3 pts |
| Nova Scotia | 123 | 124 | -1 | 3.3% | 0.0 pts |
| Newfoundland and Labrador | 122 | 134 | -12 | 1.6% | -0.2 pts |
| Ontario | 118 | 111 | +7 | 46.2% | +2.7 pts |
| Saskatchewan | 109 | 124 | -15 | 3.4% | -0.4 pts |
| British Columbia | 94 | 91 | +3 | 12.9% | +0.5 pts |
| Quebec | 33 | 33 | 0 | 7.2% | -0.1 pts |
| Province | Small-dollar average | Installment average |
|---|---|---|
| Alberta | $499 | $5,355 |
| New Brunswick | $524 | $5,712 |
| Prince Edward Island | $479 | n/a |
| Manitoba | $442 | $6,155 |
| Nova Scotia | $467 | $5,071 |
| Newfoundland and Labrador | $495 | $8,005 |
| Ontario | $482 | $6,019 |
| Saskatchewan | $487 | $5,950 |
| British Columbia | $479 | $5,385 |
| Quebec | $560 | $6,815 |
n/a: fewer than 100 applications.
This edition is the first to report what happened after people applied. Almost every approval came quickly. Of the approvals made by the approving lenders in our network, 97% came within 24 hours of the application, about three hours after it on average.
Funding depends on the size of the loan. Of loans under $1,500, 76% were funded within 72 hours. Larger loans took longer: 42% of loans of $1,500 and up were funded within 72 hours.
These are the times lenders reported each decision to us, so the actual times may be shorter.
| Measure | Under $1,500 | $1,500 and up |
|---|---|---|
| Funded within 72 hours | 76% | 42% |
Approvals within 24 hours, all request sizes: 97%.
Next release: Tuesday 5 January 2027, Q4 2026 edition.
Canonical URL: https://smarter.loans/research/lending-demand-index-q3-2026/
Preferred citation: Smarter Loans, The Canadian Lending Demand Index, Q3 2026 edition, 13 October 2026, https://smarter.loans/research/lending-demand-index-q3-2026/
Smarter Loans is a Canadian loan comparison platform. Index data is aggregated platform application data, free to cite with attribution to the Smarter Loans Lending Demand Index.
Methodology · Previous edition: H1 2026
The full rules live on the standing methodology page. If a report and that page ever disagree, the report is wrong.
Borrowing demand at the point of application: how much Canadians ask for, what for and where. From this edition it also reports how quickly approvals and funding came through in our lending network.
In our lending network, 97% of approvals for applications from August to September 2026 came within 24 hours, about three hours on average. Funding took longer: 76% of loans under $1,500 were funded within 72 hours.
Two thirds. From July to September 2026, 66% of personal loan requests on Smarter Loans were under $1,500, the same share as in the first half of 2026.
Quebec can refuse a lender's permit above a 35% credit rate, so conventional payday lending is largely absent. The index reflects that different market rather than lower need.
Quarterly. The Q4 2026 edition publishes on Tuesday 5 January 2027.
Yes. Index data is free to cite with attribution to the Smarter Loans Lending Demand Index and a link to this page.
Data tables accompany every chart. Next release: Q4 2026 Edition, Tuesday 5 January 2027. Press and researcher inquiries: info@smarter.loans.