Lending demand rose 30.6 percent in the strongest half since 2024, and the typical request got smaller. This Index measures the side of credit Canada has never counted: what borrowers ask for, before any lender decides.
Canadian borrowing demand grew 30.6 percent year over year in the first half of 2026, in both quarters and all ten covered provinces. Two thirds of personal requests are now under $1,500, and the average installment request fell from $6,229 to $6,061. Canadians are applying more often for smaller amounts.
Demand grew in both quarters and every covered province. Ontario grew fastest, up 52.6 percent.
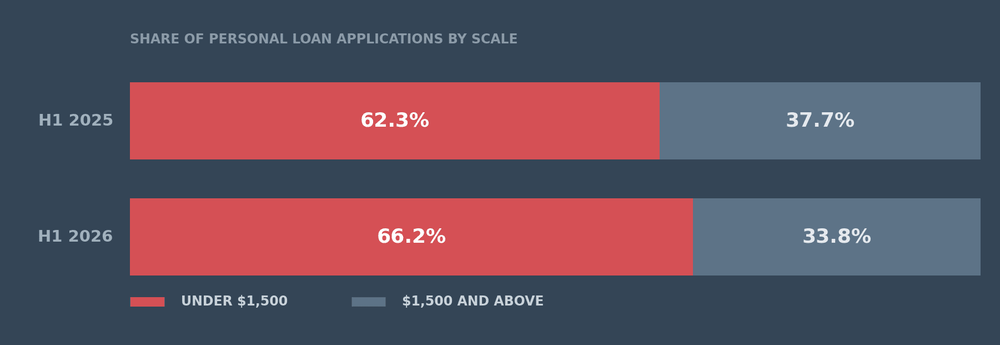
Two thirds of personal requests are now under $1,500, up from 62.3 percent a year ago. The average small-dollar ask is $495, while the average installment ask fell from $6,229 to $6,061. Canadians are borrowing more often, in smaller amounts.
Albertans apply nearly five times more often per capita than Quebecers. Quebec applicants request the most per application of any province: $575 small-dollar, $6,886 installment.
New recurring metric, the Borrowing Stress Ratio: small-dollar requests equal 13 percent of a month's income, installment requests 117 percent, and the share rises with credit score, from 46 percent below 560 to 110 percent above 725.
One in five business loan applications is to start a new company, and they ask the most: $124,450 against an overall business average of $98,168. Would-be founders applying through personal channels ask for $9,646, a thirteen-fold financing gap.
Personal lending demand splits cleanly at the $1,500 line. Below it sits everyday borrowing measured in hundreds of dollars; above it, a genuine installment market with requests in the thousands. The two moved in opposite directions this half: the small-dollar side grew its share while the installment side asked for less.
| Segment, H1 2026 | Share of demand | Average request | H1 2025 average |
|---|---|---|---|
| Small-dollar (payday-scale) | 66.2% | $495 | $476 |
| Installment-scale | 33.8% | $6,061 | $6,229 |
Published averages exclude entries outside the plausible product range; see methodology.
Paying off bills is the single largest stated purpose at 34.4 percent of applications, followed by debt consolidation at 10.2 percent and medical expenses at 9.6 percent. Consolidation carries the largest installment-scale requests, averaging $8,346, followed by home improvement at $7,909. Medical-purpose demand grew 38.1 percent year over year on a clean quarterly comparison, the fastest of any purpose; start-a-business purpose declined 22.1 percent.
| Purpose | Share of demand | Small-dollar avg | Installment avg |
|---|---|---|---|
| Pay Off Bills | 34.4% | $517 | $4,838 |
| Debt Consolidation | 10.2% | $633 | $8,346 |
| Medical Expenses | 9.6% | $459 | $4,700 |
| Moving | 4.4% | $512 | $4,334 |
| Improve Credit | 4.0% | $500 | $6,017 |
| Home Improvement | 2.8% | $544 | $7,909 |
| Education | 2.2% | $534 | $6,624 |
Top stated purposes shown; the general-purpose category is excluded from growth claims due to a 2025 taxonomy change.
Per-capita demand varies nearly fivefold across the country. Alberta leads at an index of 158.4 against a national base of 100; Quebec sits at 33.4. Ontario, the largest market by volume share, grew fastest at 52.6 percent year over year. Request sizes tell a different story: Quebec's averages are the country's highest at both scales, consistent with a provincial rate cap that filters out the smallest-dollar lending.
| Province | Per-capita index | Small-dollar avg | Installment avg |
|---|---|---|---|
| Alberta | 158.4 | $513 | $5,917 |
| Saskatchewan | $488 | $5,961 | |
| Manitoba | $435 | $5,758 | |
| British Columbia | $494 | $5,647 | |
| Ontario | $486 | $6,107 | |
| Quebec | 33.4 | $575 | $6,886 |
| Nova Scotia | $467 | $5,622 | |
| New Brunswick | $517 | $5,731 | |
| Newfoundland and Labrador | $496 | $6,257 | |
| Prince Edward Island | $466 | n/a (small sample) |
Territories excluded pending data verification; segments under 100 applications suppressed. Per-capita figures are partial; bars are not rendered for provinces without a published index value.
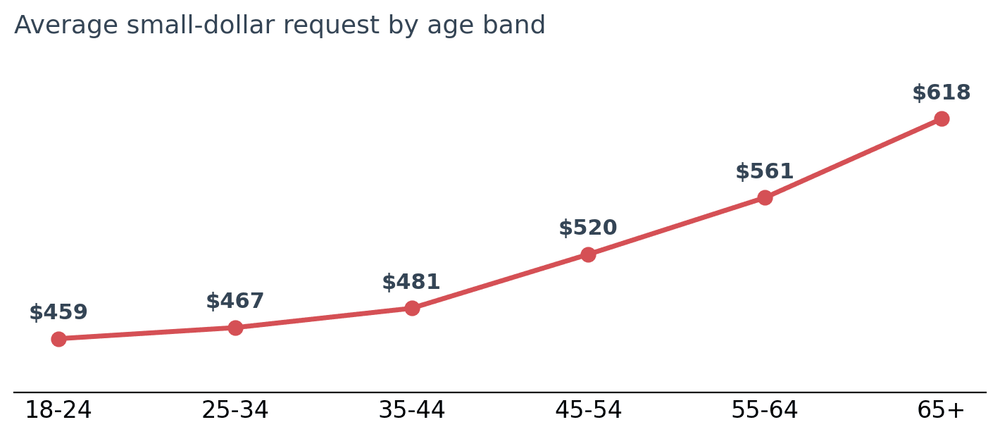
Applicants aged 18 to 24 are the fastest-growing group in the country. At small-dollar scale, the average request climbs steadily with age, from $459 among 18 to 24 year olds to $618 among applicants 65 and older, a 35 percent difference end to end. Installment-scale requests peak in the 45 to 54 band at $6,299.
| Age band | Small-dollar avg | Installment avg |
|---|---|---|
| 18 to 24 | $459 | $5,568 |
| 25 to 34 | $467 | $5,947 |
| 35 to 44 | $481 | $5,999 |
| 45 to 54 | $520 | $6,299 |
| 55 to 64 | $561 | $6,276 |
| 65 and over | $618 | $5,975 |
Most verified applicants sit below the credit threshold where mainstream lending ends. The composition is shifting: the below-560 share of verified applications fell from 42.0 to 37.4 percent year over year. Request size rises with credit standing at both scales; verified applicants above 725 average $10,906 at installment scale, more than double the below-560 average of $5,282.
| Credit band (verified) | Small-dollar avg | Installment avg |
|---|---|---|
| Below 560 | $491 | $5,282 |
| 560 to 659 | $504 | $6,147 |
| 660 to 724 | $558 | $8,262 |
| 725 and above | n/a (small sample) | $10,906 |
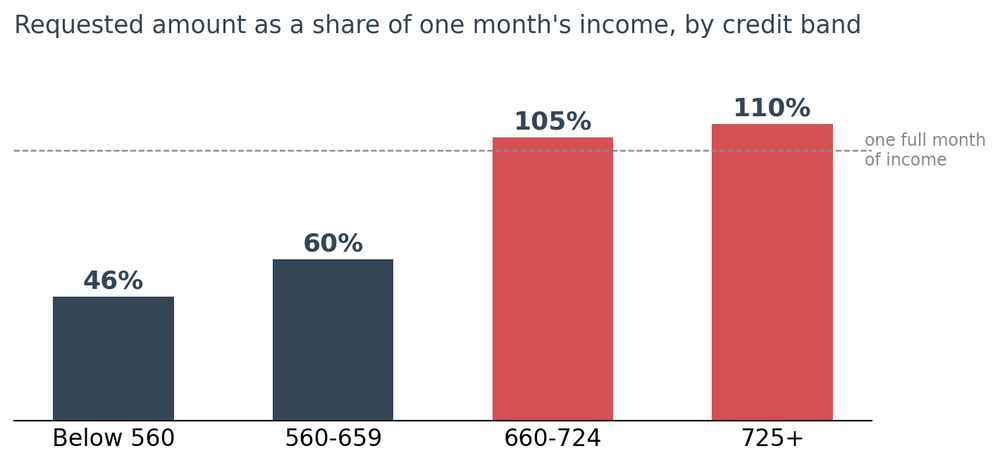
Debuting in this edition and recurring in every future one: the average requested amount expressed as a share of the same applicants' average monthly income. Small-dollar demand is fractional: a typical request equals 13 percent of one month's income. Installment demand is structural: 117 percent, slightly more than a full month. The share climbs with credit standing, meaning better-credit applicants borrow further against their income, and among purposes it peaks at debt consolidation, where the average request equals 117 percent of a month's income.
| Credit band (verified) | Share of one month's income |
|---|---|
| Below 560 | 46% |
| 560 to 659 | 60% |
| 660 to 724 | 105% |
| 725 and above | 110% |
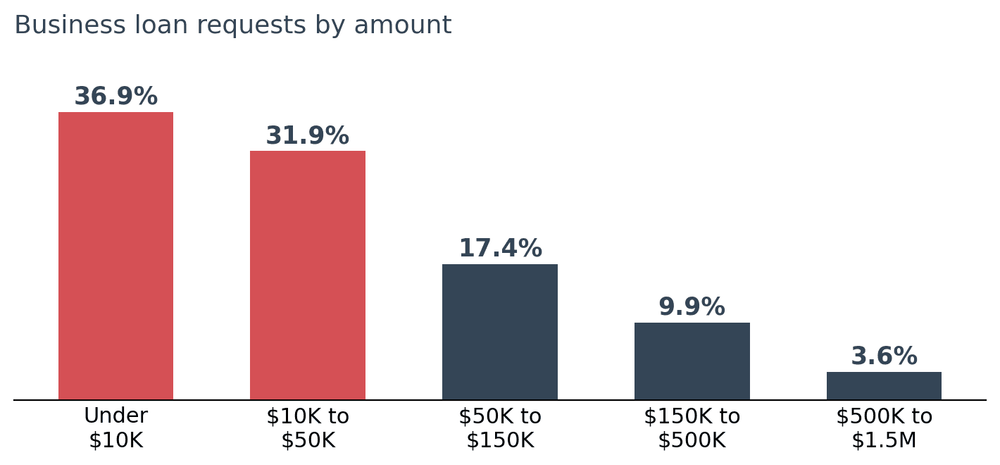
Business borrowing demand is a barbell. Two thirds of requests, 68.8 percent, are under $50,000: working-capital-scale needs from small operators. At the other end, 13.5 percent of requests exceed $150,000, and this tail pulls the overall average up to $98,168, roughly six times what a typical operator asks for. Any lender or policymaker reading business demand through the average alone misses the market's actual shape.
| Request size | Share of business demand |
|---|---|
| Under $10,000 | 36.9% |
| $10,000 to $50,000 | 31.9% |
| $50,000 to $150,000 | 17.4% |
| $150,000 to $500,000 | 9.9% |
| $500,000 to $1.5M | 3.6% |
Startup formation is the clearest signal in the data. Excluding general-purpose applications, starting a new company is the single largest stated purpose, 21.6 percent of business demand, and these applicants ask the most: $124,450 on average. Expansion follows at $118,580. Operational purposes ask far less: everyday operations averages $89,090 and inventory purchases $78,083. Read together, growth capital is requested at $110,000-plus scale while operating capital sits closer to $80,000.
| Business purpose | Share of stated purposes | Average request |
|---|---|---|
| Other (general business) | 22.8% | $103,572 |
| Start A Business | 21.6% | $124,450 |
| Everyday Operations | 15.3% | $89,090 |
| Purchase Inventory | 11.9% | $78,083 |
| Expansion | 10.6% | $118,580 |
| All other purposes | 17.9% | suppressed (small samples) |
Start-a-business demand appears on both sides of the platform, at very different scales. Applicants who apply through the business channel to start a company ask for $124,450 on average. Applicants who select the same purpose on a personal installment application ask for $9,646. That thirteen-fold gap sketches two distinct founder populations: funded ventures seeking growth capital, and individuals bootstrapping a business out of personal credit. The personal-side path is the one mainstream small business statistics never see.
The Index is built from loan applications submitted on the Smarter Loans platform, measured at the point of application and before any lending decision. All figures are aggregates: indexes, shares, and averages. No individual application data is disclosed, no lender-attributable figures appear, and no absolute application volumes are published. Segments under 100 applications are suppressed. Published averages exclude entries below the $100 product minimum and above product plausible ceilings; these exclusions cover 2.3 percent of personal records. Small-dollar (payday-scale) means requests under $1,500. The Borrowing Stress Ratio is the ratio of the average requested amount to the average monthly income of the same applicant group. Territories are excluded from provincial figures pending data verification. Year-over-year purpose comparisons use matched quarters only, due to a purpose taxonomy change in 2025. Provincial per-capita indexes use Statistics Canada population estimates, national base 100.
The full rules live on the standing methodology page. If a report and that page ever disagree, the report is wrong.
It measures borrowing demand: what Canadians ask to borrow when they submit a loan application, before any lender makes a decision. It is not a measure of approvals, funded loans, or outstanding debt.
Applications. Every figure is captured at the point of application. This is deliberate, since approval data reflects lender appetite while application data reflects household need.
The average requested amount expressed as a share of the same applicants' average monthly income. A small-dollar request equals 13 percent of a month's income; an installment request equals 117 percent.
Territorial volumes are reported annually rather than quarterly, and the data is held for verification. They are excluded from provincial figures in this edition.
Quarterly. This inaugural edition covers the first half of 2026; the next edition covers Q3 2026 and publishes in October.
No individual application data is ever disclosed. All figures are aggregates, segments under 100 applications are suppressed, and no lender-attributable figures are published.
Data tables accompany every chart. Next release: Q3 2026 Edition, October 2026. Press and researcher inquiries: [email protected].